Water quality is a valued public resource; streams with unimpaired water quality satisfy a wide variety of needs (e.g. fishing, food, recreation, aesthetic, irrigation, waste assimilation, education), whereas those with impaired water quality satisfy few, if any, needs and frequently pose health concerns.
Managing water alone is not sufficient to manage the water quality of streams. Streams are not self-contained ecosystems flowing within a defined channel, but open ecosystems dependent on the surrounding riparian habitat for energy (e.g. leaves, wood) and nutrients (Hynes 1975). The riparian habitat, consisting of forests, swamps, marshes, etc., is an integral part of the stream ecosystem influencing many environmental variables in the stream (e.g. water temperature, suspended solids concentration, base flow, habitat diversity). Land-use changes (deforestation, agriculture, urbanization) impair water quality not only by increasing the discharge of contaminants (e.g. silt, nutrients, metals, heat) to streams, but also by isolating streams from their surrounding riparian habitats (e.g. hardening banks with rip-rap, damming streams, diking banks, dredging and straightening channels) and by directly altering the riparian habitat (e.g. filling, deforesting, plowing). Water quality management thus is integrally coupled with land-use management.
Efforts to incorporate water quality management into land-use decisions and planning documents (e.g. subwatershed plans, official plans) has been hampered because of the absence of a method to rapidly determine and map the water quality of streams. This paper outlines a cost effective approach for mapping stream water quality for use in watershed management projects.
A Measure of Water Quality:
The Ontario Water Resources Act states that:
the quality of water shall be deemed to be impaired if, although the quality of the water is not or may not become impaired, the material discharged or caused or permitted to be discharged or any derivative of such material causes or may cause injury to any person, animal, bird or other living thing as a result of the use or consumption of any plant, fish or other living matter or thing in the water or in the soil in contact with the water.
Because legislation concerning water quality stresses a biological, not chemical, basis for impairment, a biological measure for water quality is used: Water quality is unimpaired where ever the community of organisms in the aquatic system is not primarily determined by an anthropogenic factor.
Benthic macroinvertebrates were selected as "the community of organisms" to measure water quality. They provide an excellent means for evaluating local water quality conditions because:
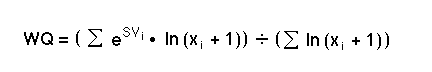
A quantitative measure of water quality (WQ) can be estimated from:
where,
Quantitative samples of the benthic community are required to measure water quality since the density (number of organisms per unit area) of each taxon is needed. Two samples are typically taken at a site and all organisms within the sampled area are collected, identified and enumerated. Mesh size for collecting nets range between 500 and 600 µm because the primary purpose of this program is to assess local water quality conditions, not to provide an inventory of all species. See Griffiths (1993) for details of sampling and identifying benthic macroinvertebrates.
Empirical results from riverine systems throughout southwestern Ontario suggest that streams (i.e. riverine systems with bankfull widths of 4 to 16m) with unimpaired water quality have WQ values above 12, while those with impaired water quality have values below 10. The water quality of streams may be impaired or unimpaired when WQ values are between 10 and 12.
To verify that the water quality measure defined above reflects environmental stress associated with land-use change in a catchment, the water quality was determined at the 19 sampling sites in five catchments from paired benthic macroinvertebrate samples collected with a Surber sampler that enclosed an area of 0.092 m-2. Land-use maps from the Ontario Ministry of Agriculture and Foods were digitized and the area of five land-use categories (wildlands, intensive agriculture, grain & hay, pasture, urban) was calculated upstream of each sampling point. WQ was regressed against the land-use categories using the model:
WQ = constant + wildlands + intensive agriculture + grain & hay+ pasture + total.
Total represented the total size of the drainage basin upstream of a sampling site and was included as a covariant in the model. Urban, which accounted for only a small proportion of the land-use in any catchment, was omitted from the model since it is equal to the total minus the other 4 land-use categories.
The first canonical variant was used to represent the composite variable, "land-use", to analyze the relationship between water quality and land-use (Figure 1).
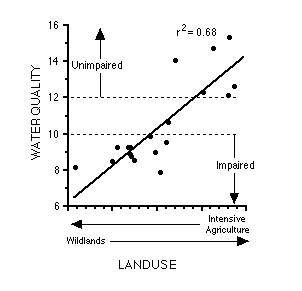 Figure 1: Relationship between water quality and upstream land-use in Grey County drainage basins. Data from the Pretty River, Rocky Saugeen River, Meaux Creek, Carrick Creek and Otter Creek.
Land-use within the catchment explained 68% of the measured variation in water quality. Water quality increased with an increase in the proportion of wildlands (i.e. forest, wetlands, reforested, agricultural land idle for >10 yr.) and with a decrease in the proportion of intensive agriculture (i.e. corn, row crops, market gardens, orchards) upstream of the sampling point. The water quality measure thus responded in the predicted manner to changes in land-use and provides a good measure of water quality impairment to non-point source pollution.
Mapping Water Quality of Streams:
Sampling benthic macroinvertebrates at a site provides a point measure of water quality. To produce a map of water quality for an entire stream or stream reach, however, requires data collected along the complete stream length and that can be correlated with the water quality point data. Multi-spectral satellite imagery is one source of data that fulfills this requirement. Although streams are generally too small to be directly observed on satellite images that are commercially available today, land-uses within the riparian habitat can be readily classified. Because the riparian habitat is an essential component of stream ecosystems, replacement of riparian wildlands (e.g. swamps, marshes, fens) with other land-uses will subsequently affect stream water quality.
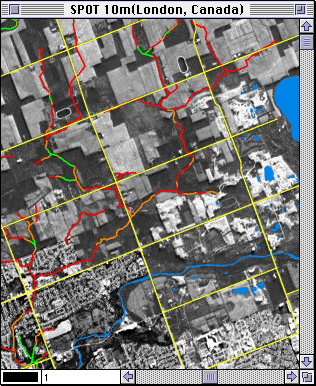
French SPOT satellite imagery of the London, Ontario, area in late spring was obtained to identify and quantify the area of wildlands within 100m of streams. The multi-spectral images are simultaneously collected in 3 wavelength bands: visible green (0.50-0.59 µm), visible red (0.62-0.68 µm) and near infrared (0.79-0.89 µm). Each image has a spatial resolution of 20m (pixel size), but when these images are combined with the panchromatic image, an effective resolution of 10m is obtained. For each pixel, the intensity of each wavelength band is recorded as a digital number from 0 to 255 (reflectance value).
A variety of land-uses (e.g. wildlands, urban, park, agriculture) within 100m of three streams in the London area were identified and located from aerial photographs, topographic maps and site visits producing a set of training sites. These training sites then were located on the satellite images. By combining specific ranges of reflectance values from each of the three bands (modelling), it was possible to determine a reflectance signature (classifier) that distinguishes wildlands from other land-uses (i.e. a parallelepiped range test decision rule). Predicted locations of wildlands in other basins were field verified to check the robustness of the classifier. Streams then were digitally traced from scanned topographic maps and corrected from field observations. A script was written (GIS model) that used the three spectral bands and the digitized stream map to determine the proportion of wildlands within 100m of the stream at each point along the stream (Griffiths & Gammon 1996). The analysis was conducted using the map processing package MapĄFactory, available from ThinkSpace Inc., London, Ontario.
Water quality measurements from 20 sites along three streams were correlated against the proportion of wildlands within 100m of the sampling points as calculated by the GIS model (Figure 2).
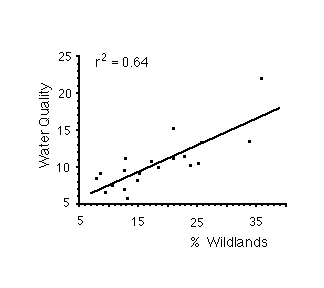 Figure 2: Relationship between water quality and the per cent of riparian habitat in wildlands. Data from Stoney Creek, Medway River and Stanton Drain in the London, Ontario area.
The proportion of wildlands within 100m of a stream explained 64% of variation in water quality. Impaired water quality (WQ values below 10) was noted at all sites with less than 20% of riparian habitat in wildlands, while unimpaired water quality (WQ values above 12) was noted at all sites with greater than 26% of riparian habitat in wildlands. Unimpaired or impaired water quality was noted at sites with between 20 and 26% of riparian habitat in wildlands. Water quality of each stream pixel thus was classified and colour coded based on the proportion of wildlands within 100m of that pixel (Figure 3):
 All stream pixels surrounded by less than 20% wildlands were classified as impaired and coloured red; stream pixels surrounded by more than 26% wildlands were classified as unimpaired and coloured green. Stream pixels surrounded by 20-26% wildlands could not be unambiguously categorized as impaired or unimpaired based solely on land-use and were coloured orange. In practice, orange coloured reaches generally reflected the water quality found immediately upstream.
A comparison of water quality predictions by the GIS model with field water quality measurements in three other London area streams suggested that the GIS model was at least 80% accurate.
Discussion:
Because water pollution is defined by its affect on living organisms, assessment of water quality must principally be conducted through biological measures. Biological responses integrate the independent and interactive effects of environmental stresses and factors, a property that makes them more robust indicators of ecosystem health than the concentrations and loadings of individual chemicals. Furthermore, the use of in situ organisms circumvents the need for any assumptions about the toxicity of chemicals to surmise their affects on aquatic life. Aquatic organisms, therefore, can be used to directly measure the effects of environmental stresses on aquatic systems, regardless of their frequency or intensity. Studies of population dynamics, food-web organization, and taxonomic structure of in situ biological communities have been much more successful at predicting the effects of anthropogenic stress on aquatic systems than approaches using single-species bioassays, mathematical models, or impact-statements, which have been singularly unsuccessful (Schindler 1987).
Classifying and mapping stream water quality is a prerequisite for water quality management. It is difficult to manage that which cannot be identified and visualized. Managing water quality, however, requires one to manage the stream ecosystem as a unit - i.e. the stream and its valley. It is evident from the relationships shown in Figures 1 and 2 that land-use in the catchment and in the riparian habitat has a direct affect on water quality. Since restoring the water quality of degraded streams is a slow, complex and expensive task, it is always prudent to protect the water quality of unimpaired streams than to attempt restoration after the fact.
The method outlined here provides a fast and cost-effective means to map the water quality of streams without requiring data from the complete drainage basin. SPOT multi-spectral satellite images for a 60x60 km area (single picture) that is ready to analyze, costs about $8,000 for 20m resolution (2 to 2.5˘ per hectare) and about $16,000 for 10m resolution (4 to 5˘ per hectare). The 20m resolution images is adequate for regions that have a high proportion of wildlands (e.g. greater than 30%) across the landscape, whereas the 10m resolution images is required for regions containing a low proportion of wildlands (e.g. less than 10%).
The accuracy of this simple method is likely sufficient for most planning and environmental monitoring purposes. If improved accuracy is necessary (i.e. reducing the length of orange stream reaches; increasing the certainty that all unimpaired stream reaches are correctly classified), then an independent source of data must be added to the GIS model such as information on surface geology or location of channelized stream reaches. Note that this methods cannot be extended to map the water quality of rivers (riverine systems with a bankfull width > 16m) because the functional linkage between a river and its immediate riparian habitat is not as well coupled.
Maps of water quality provide more than just a picture of the present Ňstate of the environmentÓ. They can be used to identify stream reaches that are potentially environmentally sensitive (e.g. isolated green reaches) or the best sites to concentrate restoration efforts (e.g. isolated orange reaches). They can also be used to better allocate sampling efforts for fish and aquatic wildlife studies to determine yields, abundance, biomass, and composition. Finally, by obtaining satellite imagery at intervals of 3 - 5 years, it is possible to tract the change in total stream length (km) with impaired and unimpaired water quality. This trend-through-time would provide a means of checking environmental policy decisions on a basin-by-basin basis. Water quality mapping thus provides a unique source of information for land-use planning.
Acknowledgments:
I gratefully acknowledge the support and encouragement of Denis Veal and John Hatton throughout this project. John Westwood assisted with many aspects of the field work. The map processing could not have been completed without the assistance of Robert Gammon.
References Cited:
Griffiths, R.W. 1993. BioMAP: Concepts, Protocols and Sampling Procedures for the Southwestern Region of Ontario. BioMAP Report SWR-1. Ministry of Environment and Energy, Southwestern Region. London, Ontario.
Griffiths, R.W. 1996. A biological measure of water quality for creeks, streams and rivers. BioMAP Report SWR-4. Ministry of Environment and Energy, Southwestern Region. London, Ontario.
Griffiths, R.W. and R. Gammon. 1996. Mapping stream water quality using satellite imagery. MapĄFactory Modelling Guide: Part II. ThinkSpace Inc., London, Ontario.
Hynes, H.B.N. 1975. The stream and its valley. Verh. Internat. Verein. Limnol. 19: 1-15.
Schindler, D.W. 1987. Detecting ecosystem responses to anthropogenic stress. Canadian Journal of Fisheries and Aquatic Sciences 44: 6-25.